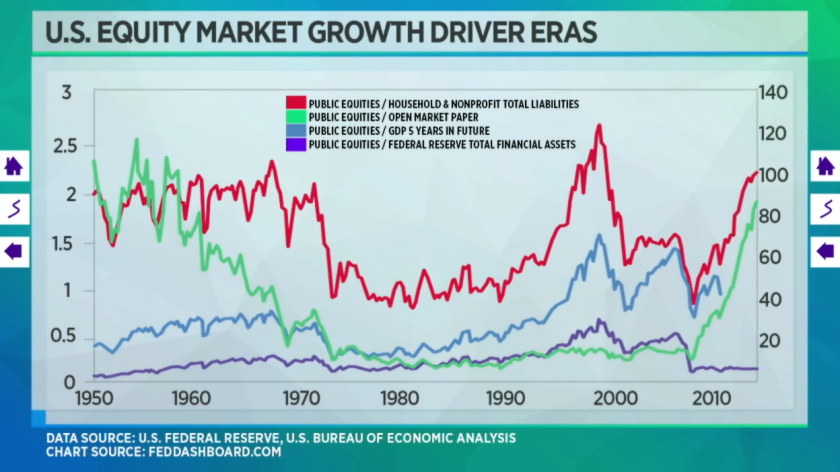
The bull market just celebrated its seventh anniversary. But the gains in recent years – as well as its recent sputter – may be explained by just one thing: monetary policy.
The factors behind that and previous bubbles can be illuminated using simple visual analysis of a chart.
The S&P 500 (^GSPC) doubled in value from November 2008 to October 2014, coinciding with the Federal Reserve Bank’s “quantitative easing” asset purchasing program. After three rounds of “QE,” where the Fed poured billions of dollars into the bond market monthly, the Fed’s balance sheet went from $2.1 trillion to $4.5 trillion.
This isn’t just a spurious correlation, according to economist Brian Barnier, principal at ValueBridge Advisors and founder of FedDashboard.com. What’s more, he says previous bull runs in the market lasting several years can also be explained by single factors each time.
Barnier first compiled data on the total value of publicly-traded U.S. stocks since 1950. He then divided it by another economic factor, graphing the ratio for each one. If the chart showed horizontal lines stretching over long periods of time, that meant both the numerator (stock values) and the denominator (the other factor) were moving at the same rate.
